
knowledge graphs
what are our knowledge graphs?
They are powerful visual and interactive representations of a network of data connections and relationship. Our software – uniquely – can drill down to the chemical/molecular level of any material used in a production process.
They provide an exceptional method to analyse and model complex real-world relationships in large data sets (unstructured and structured data sets) and enable options, permutations and similarities to be evaluated in a truly dynamic way, and at a level previously impossible.
They also allows us to very effectively communicate and measure these aspects, and to explore multiple alternatives for viability, cost and environmental savings.
| challenges of conventional LCA software | benefits of Ardhi LCA software |
|---|---|
| Time consuming inventory data collection process | Inventory collection becomes automated with integration of existing enterprise data system |
| Time consuming modelling | Quick LCA modelling once data is plugged in for an organization |
| Need to connect with multiple teams to identify the materials used, energy usage, waste generation, etc. | The system will have the details and hence needed less connect with multiple people |
| Current LCA software act as an interface for database and has no information of upstream or related flows | In Ardhi LCA all the upstream activates can be visualized and its related downstream use cases are shown |
| No transparency for the inflows and outflows - only software user can see what is used for modelling | High level of transparency for the flows - any person seeing the visualization can understand all the minute processes |
| Material or process alternatives cannot be seen | Material or process alternatives can be visualized |
| No warnings or error message for old database usages. Validity year is mentioned in documentation, but no referencing while modelling. | Timeline feature limits the use of old databases and highlights the usage of expired data or EPDs |
| Limitation of visualizing the different scenarios in a single modelling or window | During design phase timeline feature helps the visualize different scenarios and understand its impacts |
| Environmental impact matrices are non-customizable | Customizable environmental impact matrices can be developed. e.g. ECI |
| Highest impacting routes of a product system cannot be identified | Shortest path feature - can highlight the path of the most environmental impacting items in an LCA product system |
| Current LCA software’s cannot involve different stakeholders in the product design phase | Ardhi LCA visualization and its shortest path feature can be well used in new production planning or new design phases |
fully integrated software
With conventional LCA software, the use of advanced software techniques such as machine learning require the export of data to a separate machine learning software platform and for data scientists to create models and algorithms, for example to identify similarities across material types and recommend alternatives to reduce carbon.
Our LCA software utilises an integrated machine learning framework and pre-build models to reduce the time, cost and complexity. It provides configurable dashboards which show evidenced-based reporting in a clear and understandable way. Objectivity and evidence – No more greenwashing!
Please contact us to see our software in action.
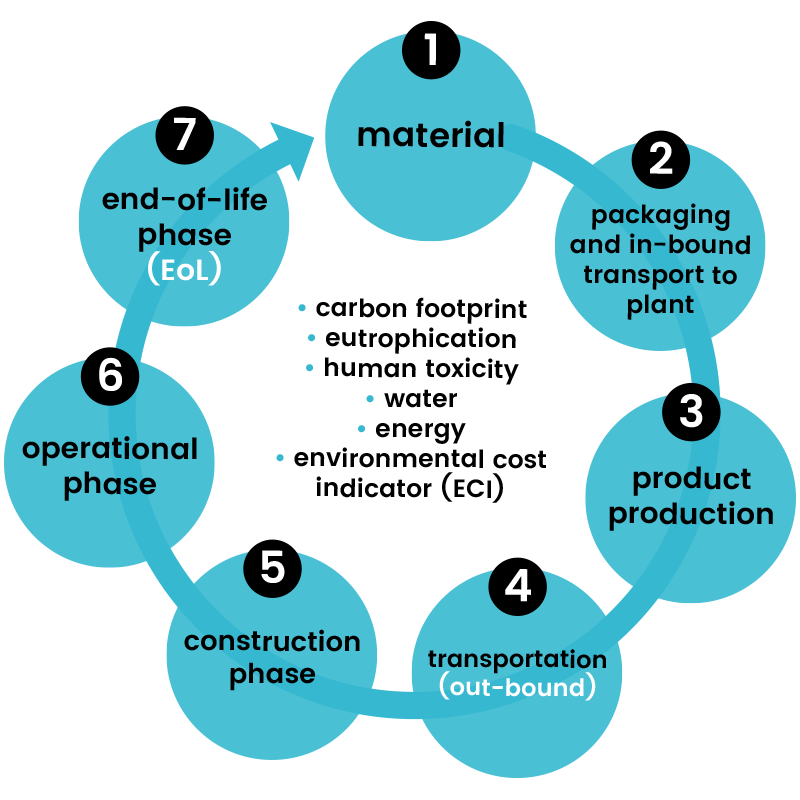
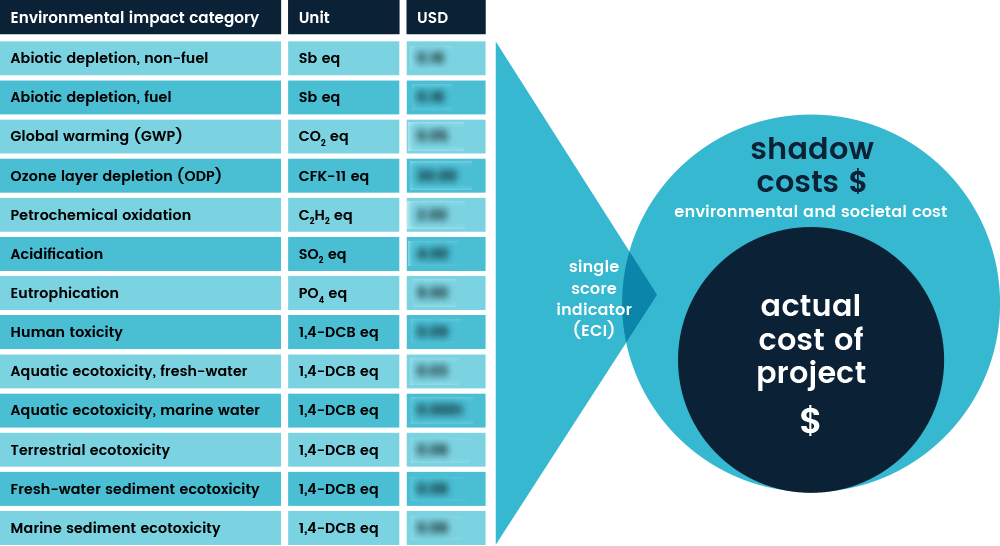
the Environmental Cost Indicator (ECI)
This is a single-score indicator expressed in cost. It unites all relevant environmental impacts into a single score of environmental costs, representing the environmental shadow price of the project.
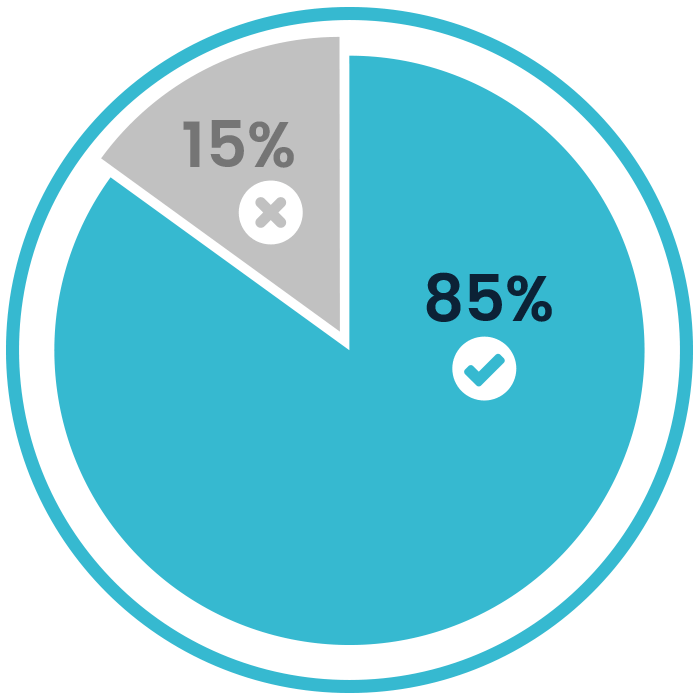
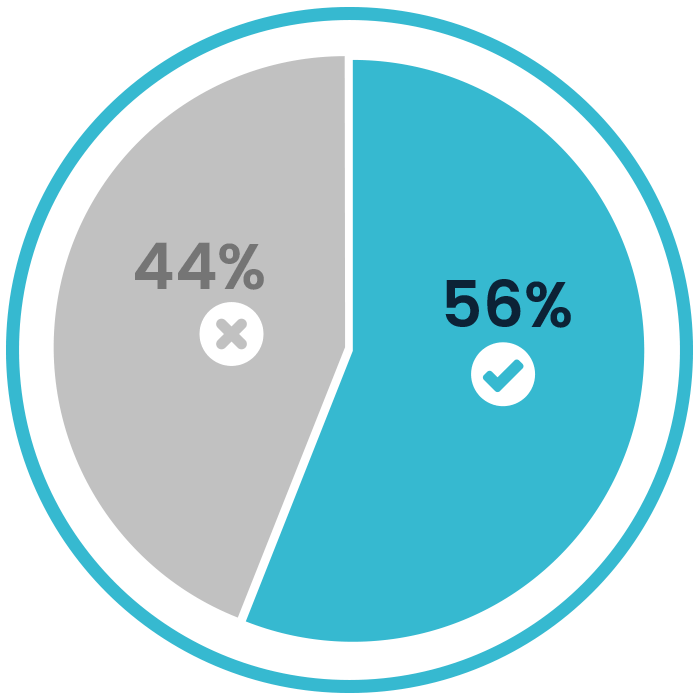
monetisation of data and analytics is hard
To what extent is your organisation currently generating measureable economic benefit from your data?Source: 2019 Gartner CDO Survey
Respondents: 293
we can help you connect carbon reporting to revenue.
Data monetisation type 1
Using data to improve internal processes and/or sharing data internally and/or eternally.
Data monetisation type 2
Using data to improve the value of existing offerings and/or exchanging data insights internally for rewards.

Data monetisation type 3
Selling or licensing data for cash directly and/or through brokers or marketplaces.